
Analysis views are comprised of a single chart typically displaying one metric, with several filters and Show Bys available. The purpose of these charts is to provide a large amount of flexibility when you combine Show Bys and filters. Furthermore, when selecting multiple dates, additional columns will appear. This will allow you to compare across time for the specific dimensions selected.
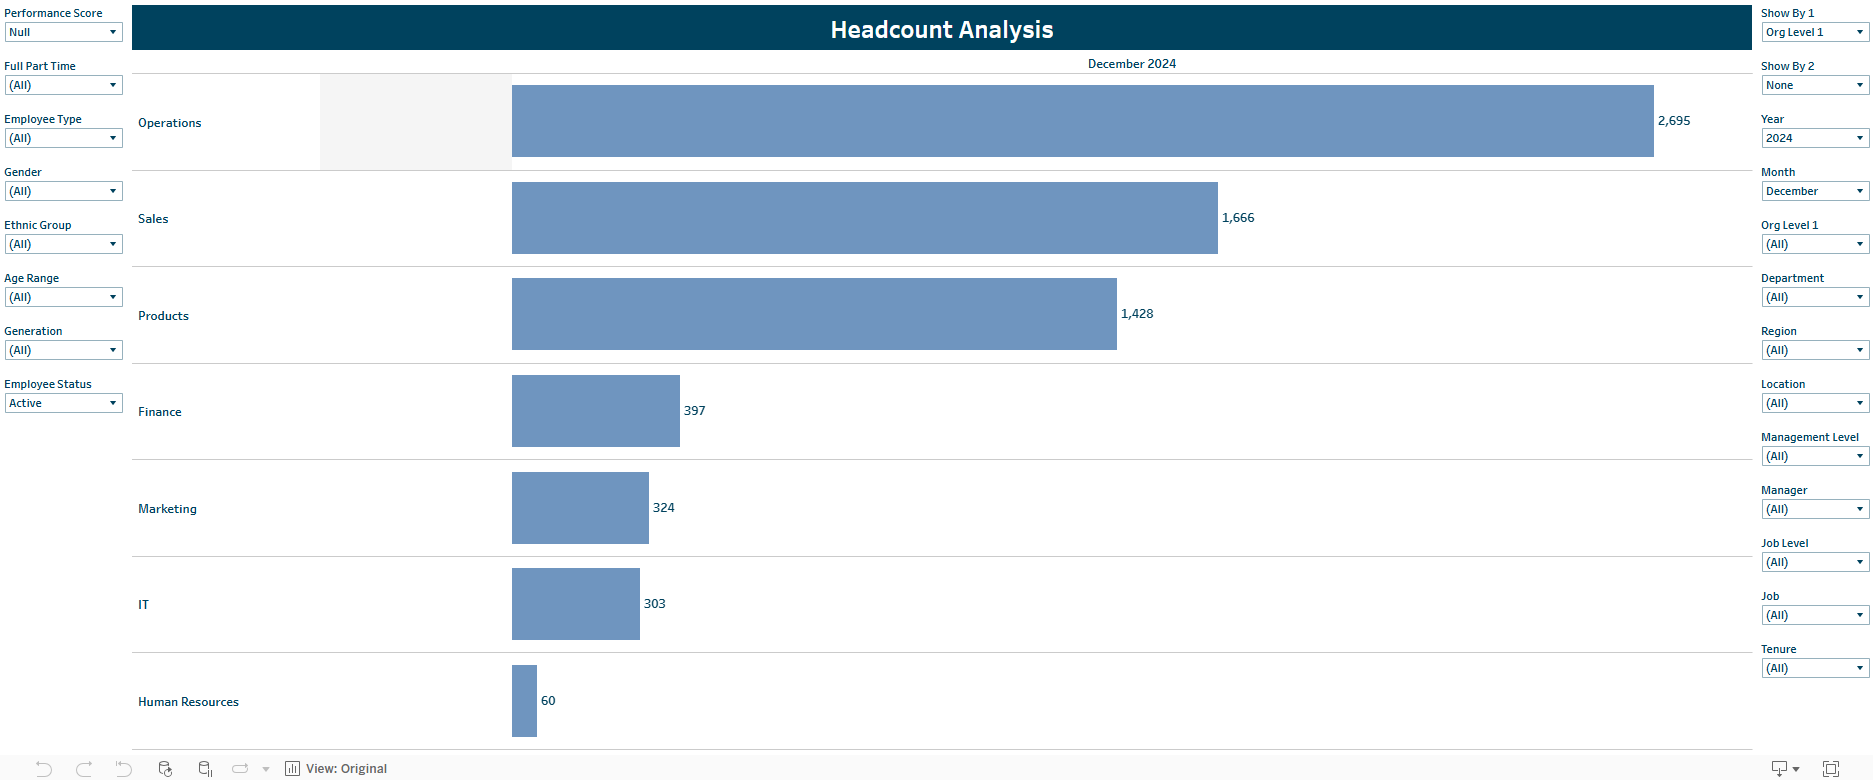
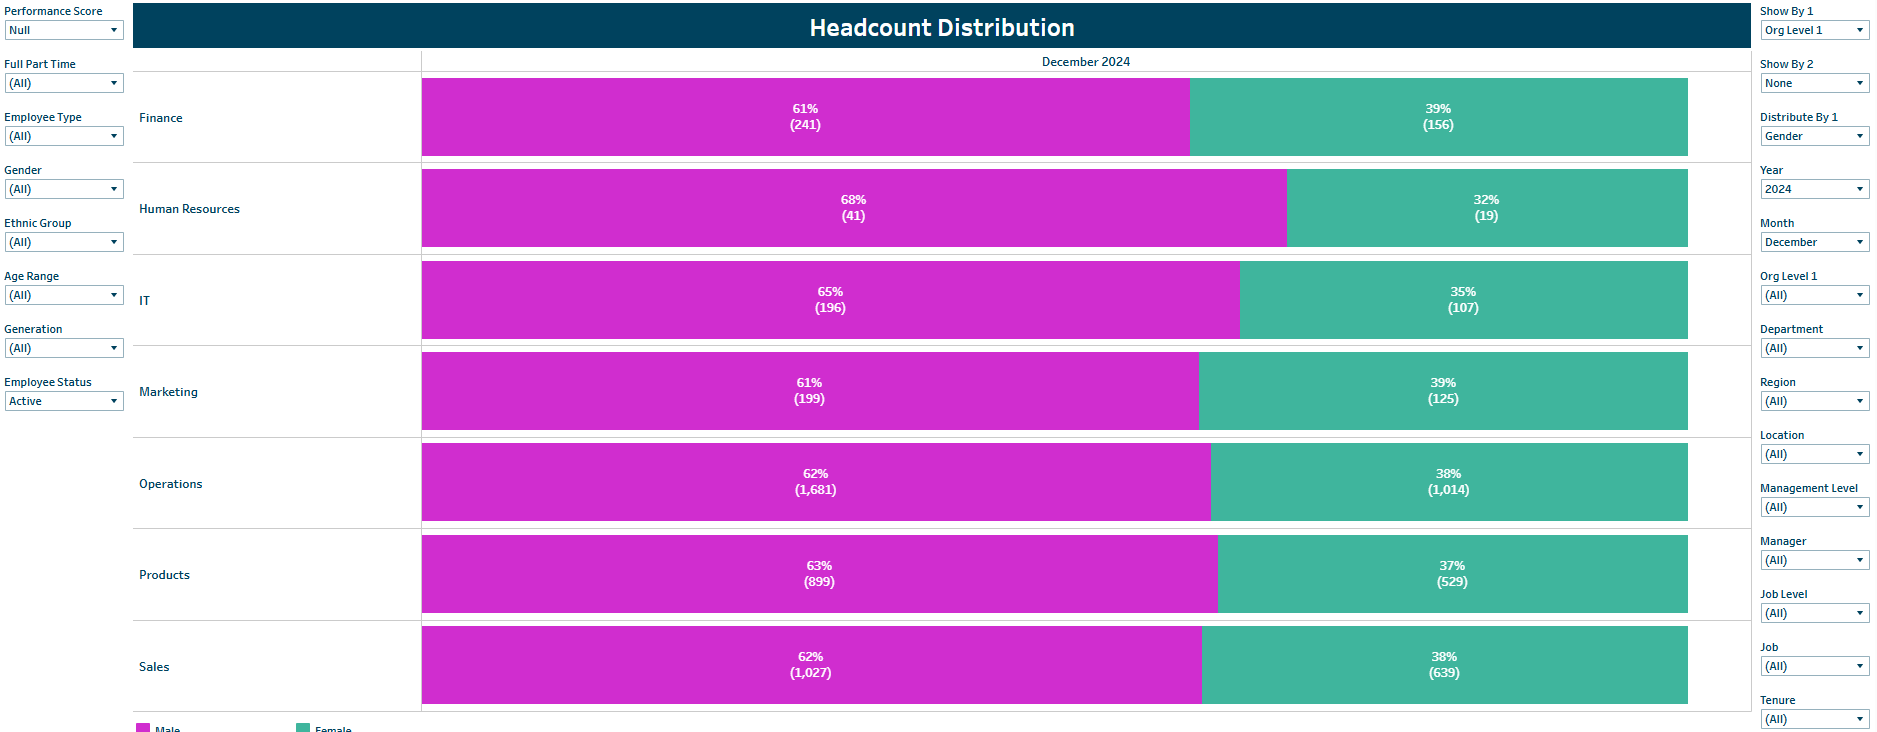
(To see a larger version, right click and open image in new tab)
For more information on Show Bys, please visit our Show Bys Guide.
Since PeopleInsight is customized for clients, your Analysis Views may not look the same as the example provided.