
Filtering is a tool in PeopleInsight that allows you to narrow the scope of data that you can see on a dashboard or other view. This article will go over where to find filters, how to use filters, and types of filters.
Where to Find Filters
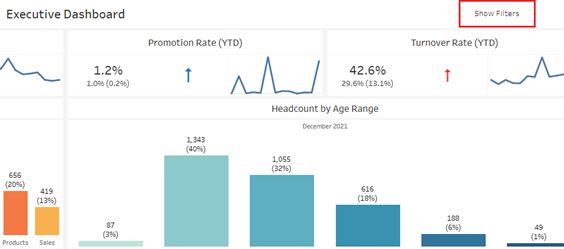
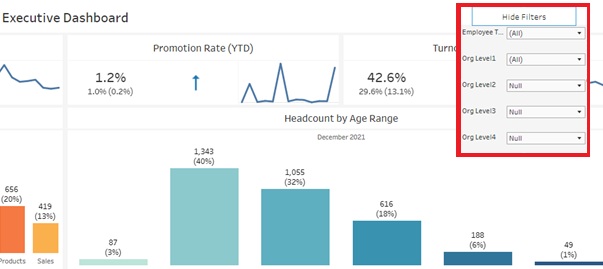
Filters can be found on the right-hand side of a dashboard or view. If they aren’t visible when you first open a dashboard, look for a “Show Filters” button in the top-right corner. Click this button and the filters will appear.
How to Use Filters
To filter down on a field, click on the field’s corresponding drop-down menu and then select one or more values. Then hit “Apply”.
For example, to filter down to Finance in Org Level1, click on the dropdown menu beside Org Level1, select Finance, and then hit “Apply”. Now the dashboard will only show values for employees that are in Finance.
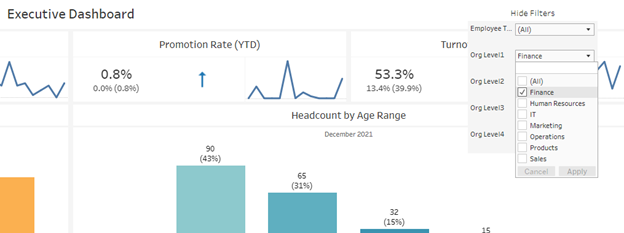
Further, you are able to apply multiple filters. For example, if you have filtered on Finance and decide that you would like to see all of the Independent Contractors that are in Finance, select Independent Contractor in the Employee Type filter and hit “Apply”.
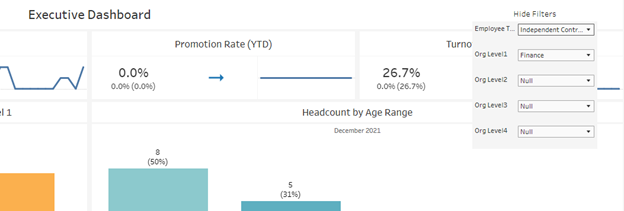
When a filter is applied, it will update other filters. For example, if you filtered Employee Type to Independent Contractor and there were not Independent Contractors in the Finance Org Level 1, then the option to filter Org Level 1 to Finance would not be available.
If you want to reset your view to what it looked like before filters were applied, click the “Reset View” button in the bottom left.

Types of Filters
Dimension Filters
Dimension filters are used to filter to a field such as Org Level 1, Employee Type, Gender, or Performance. They can be used to narrow the scope of data on a dashboard to a specific group of people.
Time Filters
Time filters are used to filter the view to a specific time period or to show a comparison of different time periods.
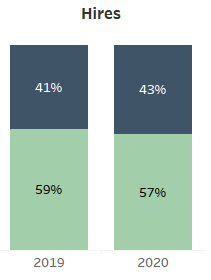
For example, looking at the Hires distribution chart below, you may want to see the data for all of 2019. In this case, set the Year filter to 2019.
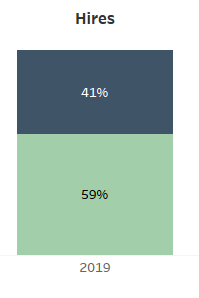
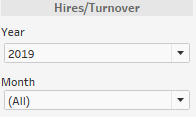
Or, if you are looking to see what the distribution was like in one or multiple months of 2019, use the month filter. For example, if you are interested in February 2019, set the month and year filters accordingly.
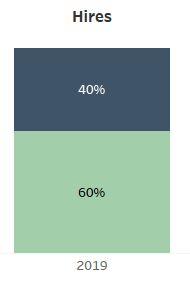
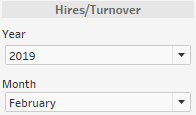
Further, if you would like to compare two or more years, select these years in the Year filter. This will cause each year to appear side-by-side, allowing for easy visual comparison.
If you are looking to apply multiple filters at once, check out our Pause Auto Updates article to learn how you can do this more efficiently.
If you are commonly setting the same filters, check out our Custom Views article to learn how you can save a preset of filters.