
(To see a larger version, right click and open image in new tab)
Business Problem: The customer was delivering training through a mix of online and in-person sessions for new starters. Due to high travel costs, in-person training was only available for certain employees based on location. However, the customer lacked clear data on how this impacted profitability, especially the break-even point of training costs versus profit generated by trained staff.
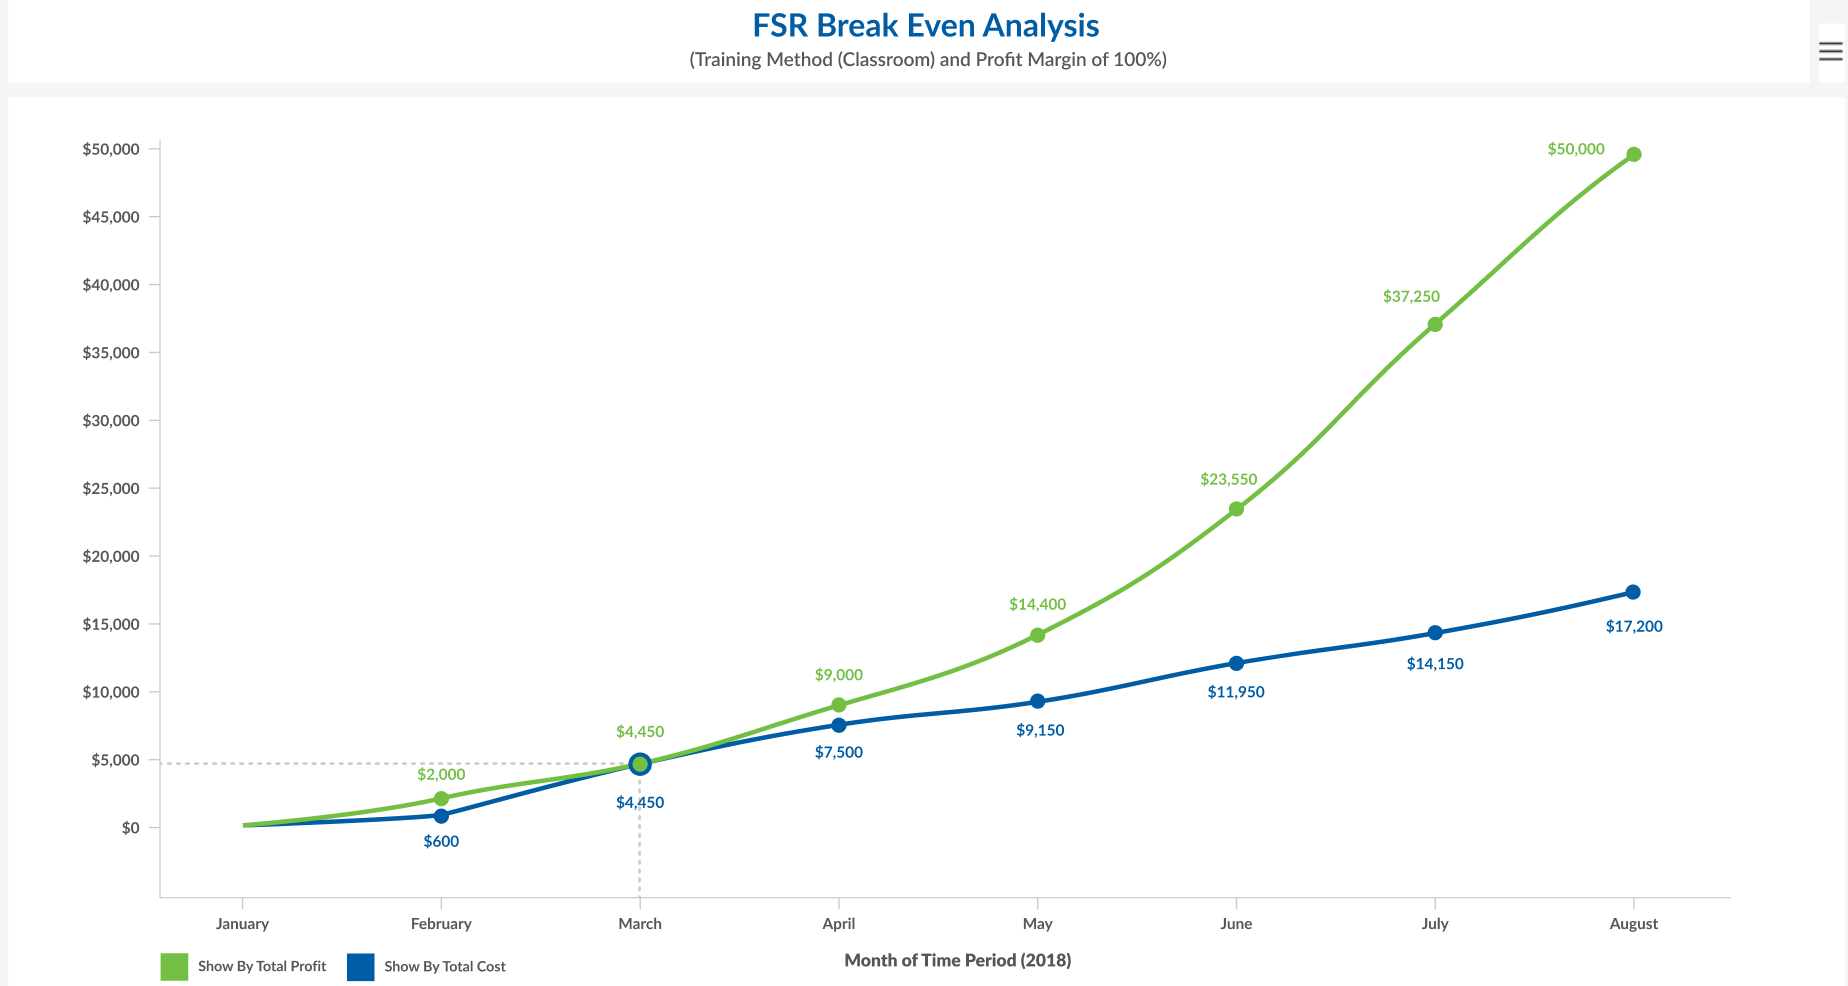
How This Dashboard Helps: This "FSR Break-Even Analysis" dashboard visually demonstrates the total profit and total cost over time for classroom-based (in-person) training. By showing how costs grow steadily while profits rise rapidly, the dashboard pinpoints the exact break-even point (March), where profits begin to outpace training costs. It offers a side-by-side view of how quickly in-person training investments translate into financial gains, providing critical data to evaluate the effectiveness of their training methods.
Impact: By analyzing the break-even point for both in-person and online training, the customer discovered that employees trained onsite reached profitability much faster than those trained online. This insight prompted a strategic shift: the company transitioned all new starter training to in-person sessions, despite the travel costs, as the long-term profit gains far outweighed the initial expenses. This data-driven decision has enabled the company to accelerate its return on investment (ROI) from training programs and enhance overall workforce effectiveness.
Please note: The dashboards featured in this workbook are design mock-ups inspired by real customer dashboards. Data and calculations are not reflective of real data.