
This article will walk you through logging into PeopleInsight, followed by a basic rundown on workbooks and interacting with dashboards. The workbooks section describes workbook actions and downloading. Interacting with dashboards gives an introduction to filtering and Show Bys.
As a note, PeopleInsight dashboards are visually optimized for viewing on 24 and 27 inch monitors. As such, we highly recommend using your monitor to view your PeopleInsight dashboards. If you are using a smaller laptop screen, we recommend adjusting your browser's zoom to around 67% for the best visual experience.
Logging In
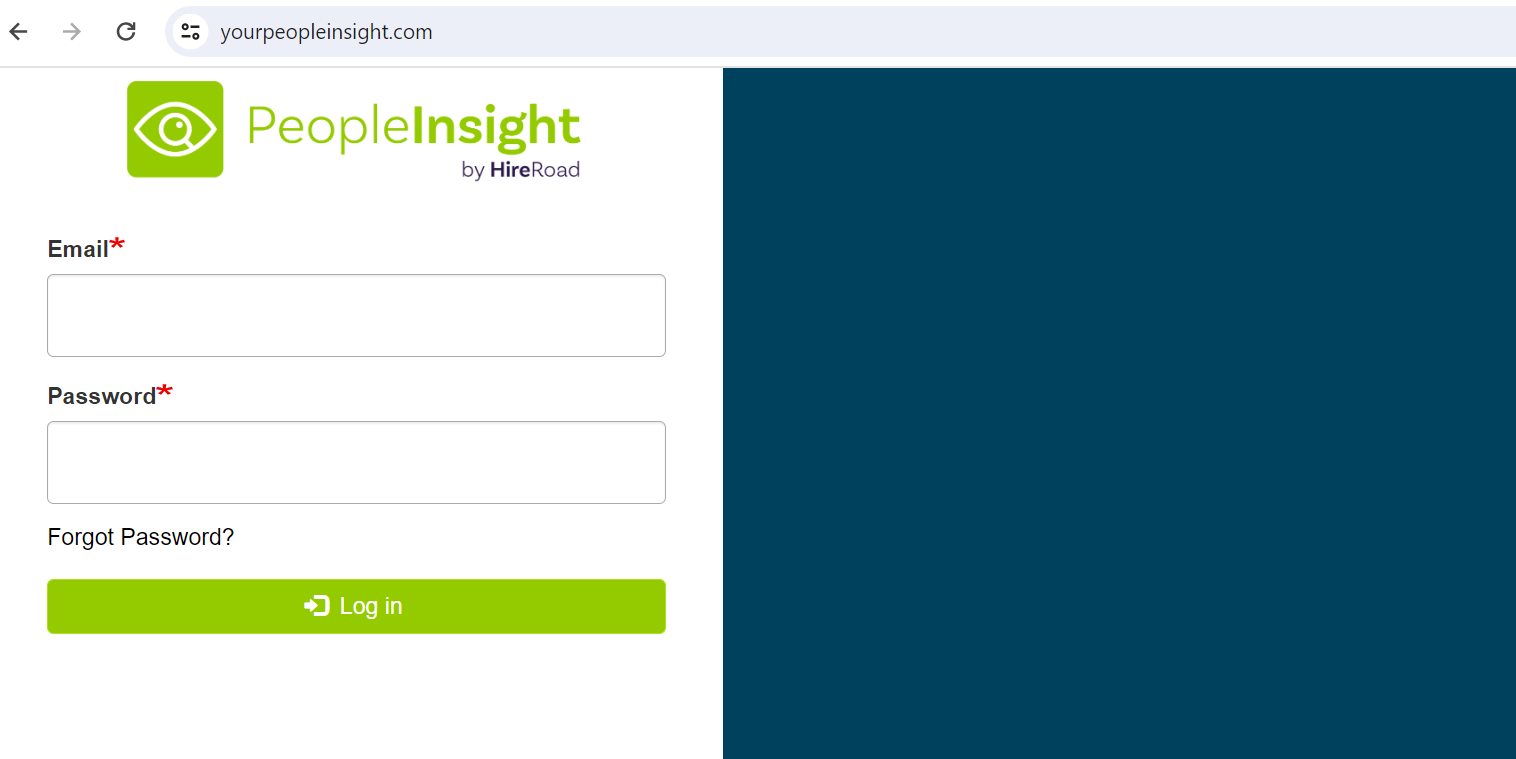
• Go to https://yourpeopleinsight.com
• Log in using your email address.
• Initially a password setup email is sent to you where you set your own password
• If you forget your password, you can reset it using the link on the login page
Workbooks
Once logged in, you will see icons that contain your set of analytic workbooks.
Each workbook contains a set of analytics.
Click on a on an icon to open it. Once there, navigation between the views can be done by:
• Using the tabs along the top
• Click on the downward pointing arrow in the upper left corner and choosing a view from the dropdown list.
Workbook Actions
To go back to the workbook selection page, click on the Analytics tab at the top. This returns the workbook you were in to its default settings.
In the top right corner there is a User Menu that allows you to change your password or log out.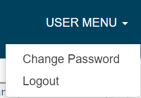
The following actions can be performed with the buttons in the bottom left:
• UNDO: undoes the last action you have performed
• REDO: re-applies the last action
• REVERT: resets the view to default settings
• REFRESH: keeps any actions while refreshing the view
• PAUSE: allows you to make several filter selections without the view changing until you hit resume

Downloading
The download option in the bottom right can be used to download the view in PDF, Crosstab, Data, and Image formats where applicable.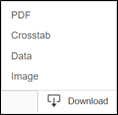
For more information, please visit our Downloading guide.
Interacting with the Dashboard
Filtering
Along the right side of the page there are filters that can be used to filter down on the views to only display the data selected in the filters.
For more information, please visit Filtering 101.
Show Bys
On analysis views there are showbys which allow you to change what the view is broken out by.
Hover for Additional Details
If you hover on the different sections of graphs you ca see information about that particular section of the graph. If a hyperlink appears, you can drill down to the associated data details
If you hover over the labels of a graph, you may see a little plus symbol appear. This allows you to break the data down to a more granular level on the certain graph. To decrease granularity, click on the minus symbol on the higher level breakout labels.
For more information, please visit The Power of Show Bys.