
(To see a larger version, right click and open image in new tab)
Business Problem: The customer lacked visibility into how office spaces were being used, making it difficult to make informed decisions on where to invest in office space and resources. They also needed a way to track the return on investment (ROI) of new spaces as they adjusted their office footprint.
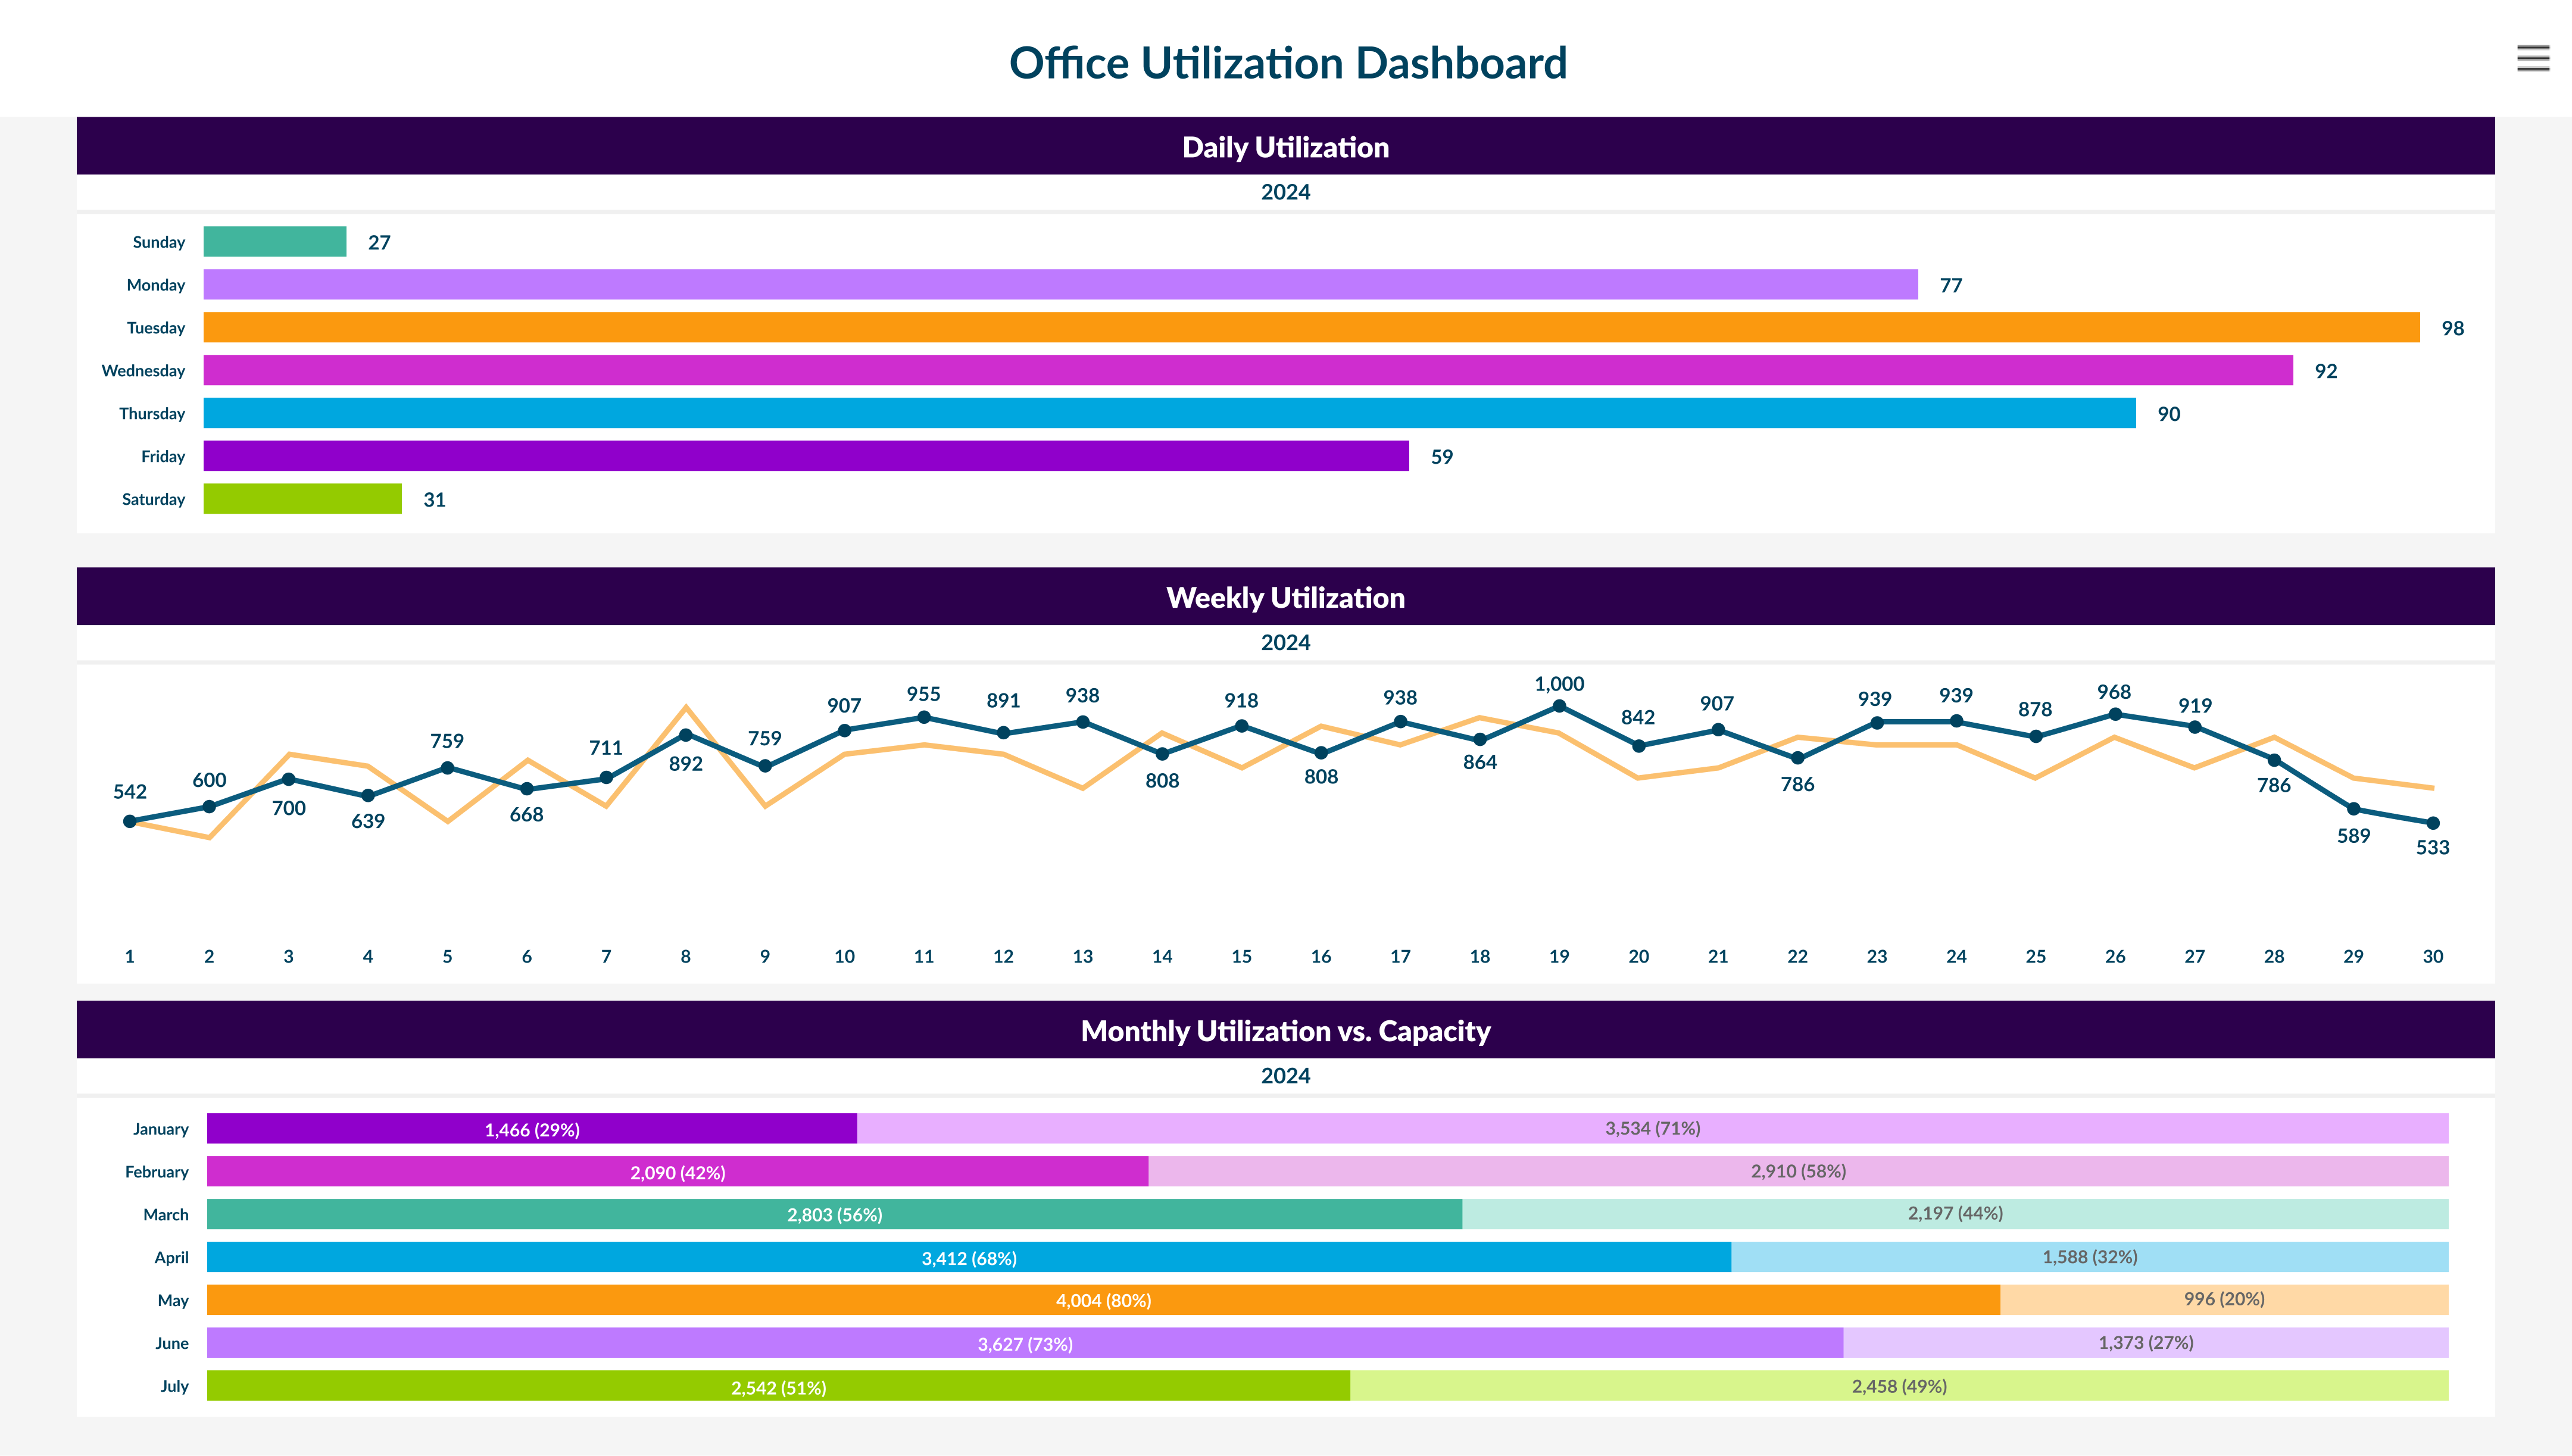
How This Dashboard Helps: This dashboard provides a clear view of office utilization, including monthly and weekly usage compared to capacity. By displaying usage data alongside capacity, the customer can see how many workers are utilizing specific spaces and when peak occupancy occurs. This enables them to make smarter, data-driven decisions about where to invest in office space and workplace resources.
Impact: The insights gained from this dashboard allow the customer to optimize their office layout, invest in high-demand spaces, and reallocate or downsize underutilized areas. They can also track the ROI of new office spaces as they shift their workplace footprint, ensuring that future investments are aligned with actual usage and business needs, leading to cost savings and more efficient resource management.
Please note: The dashboards featured in this workbook are design mock-ups inspired by real customer dashboards. Data and calculations are not reflective of real data