
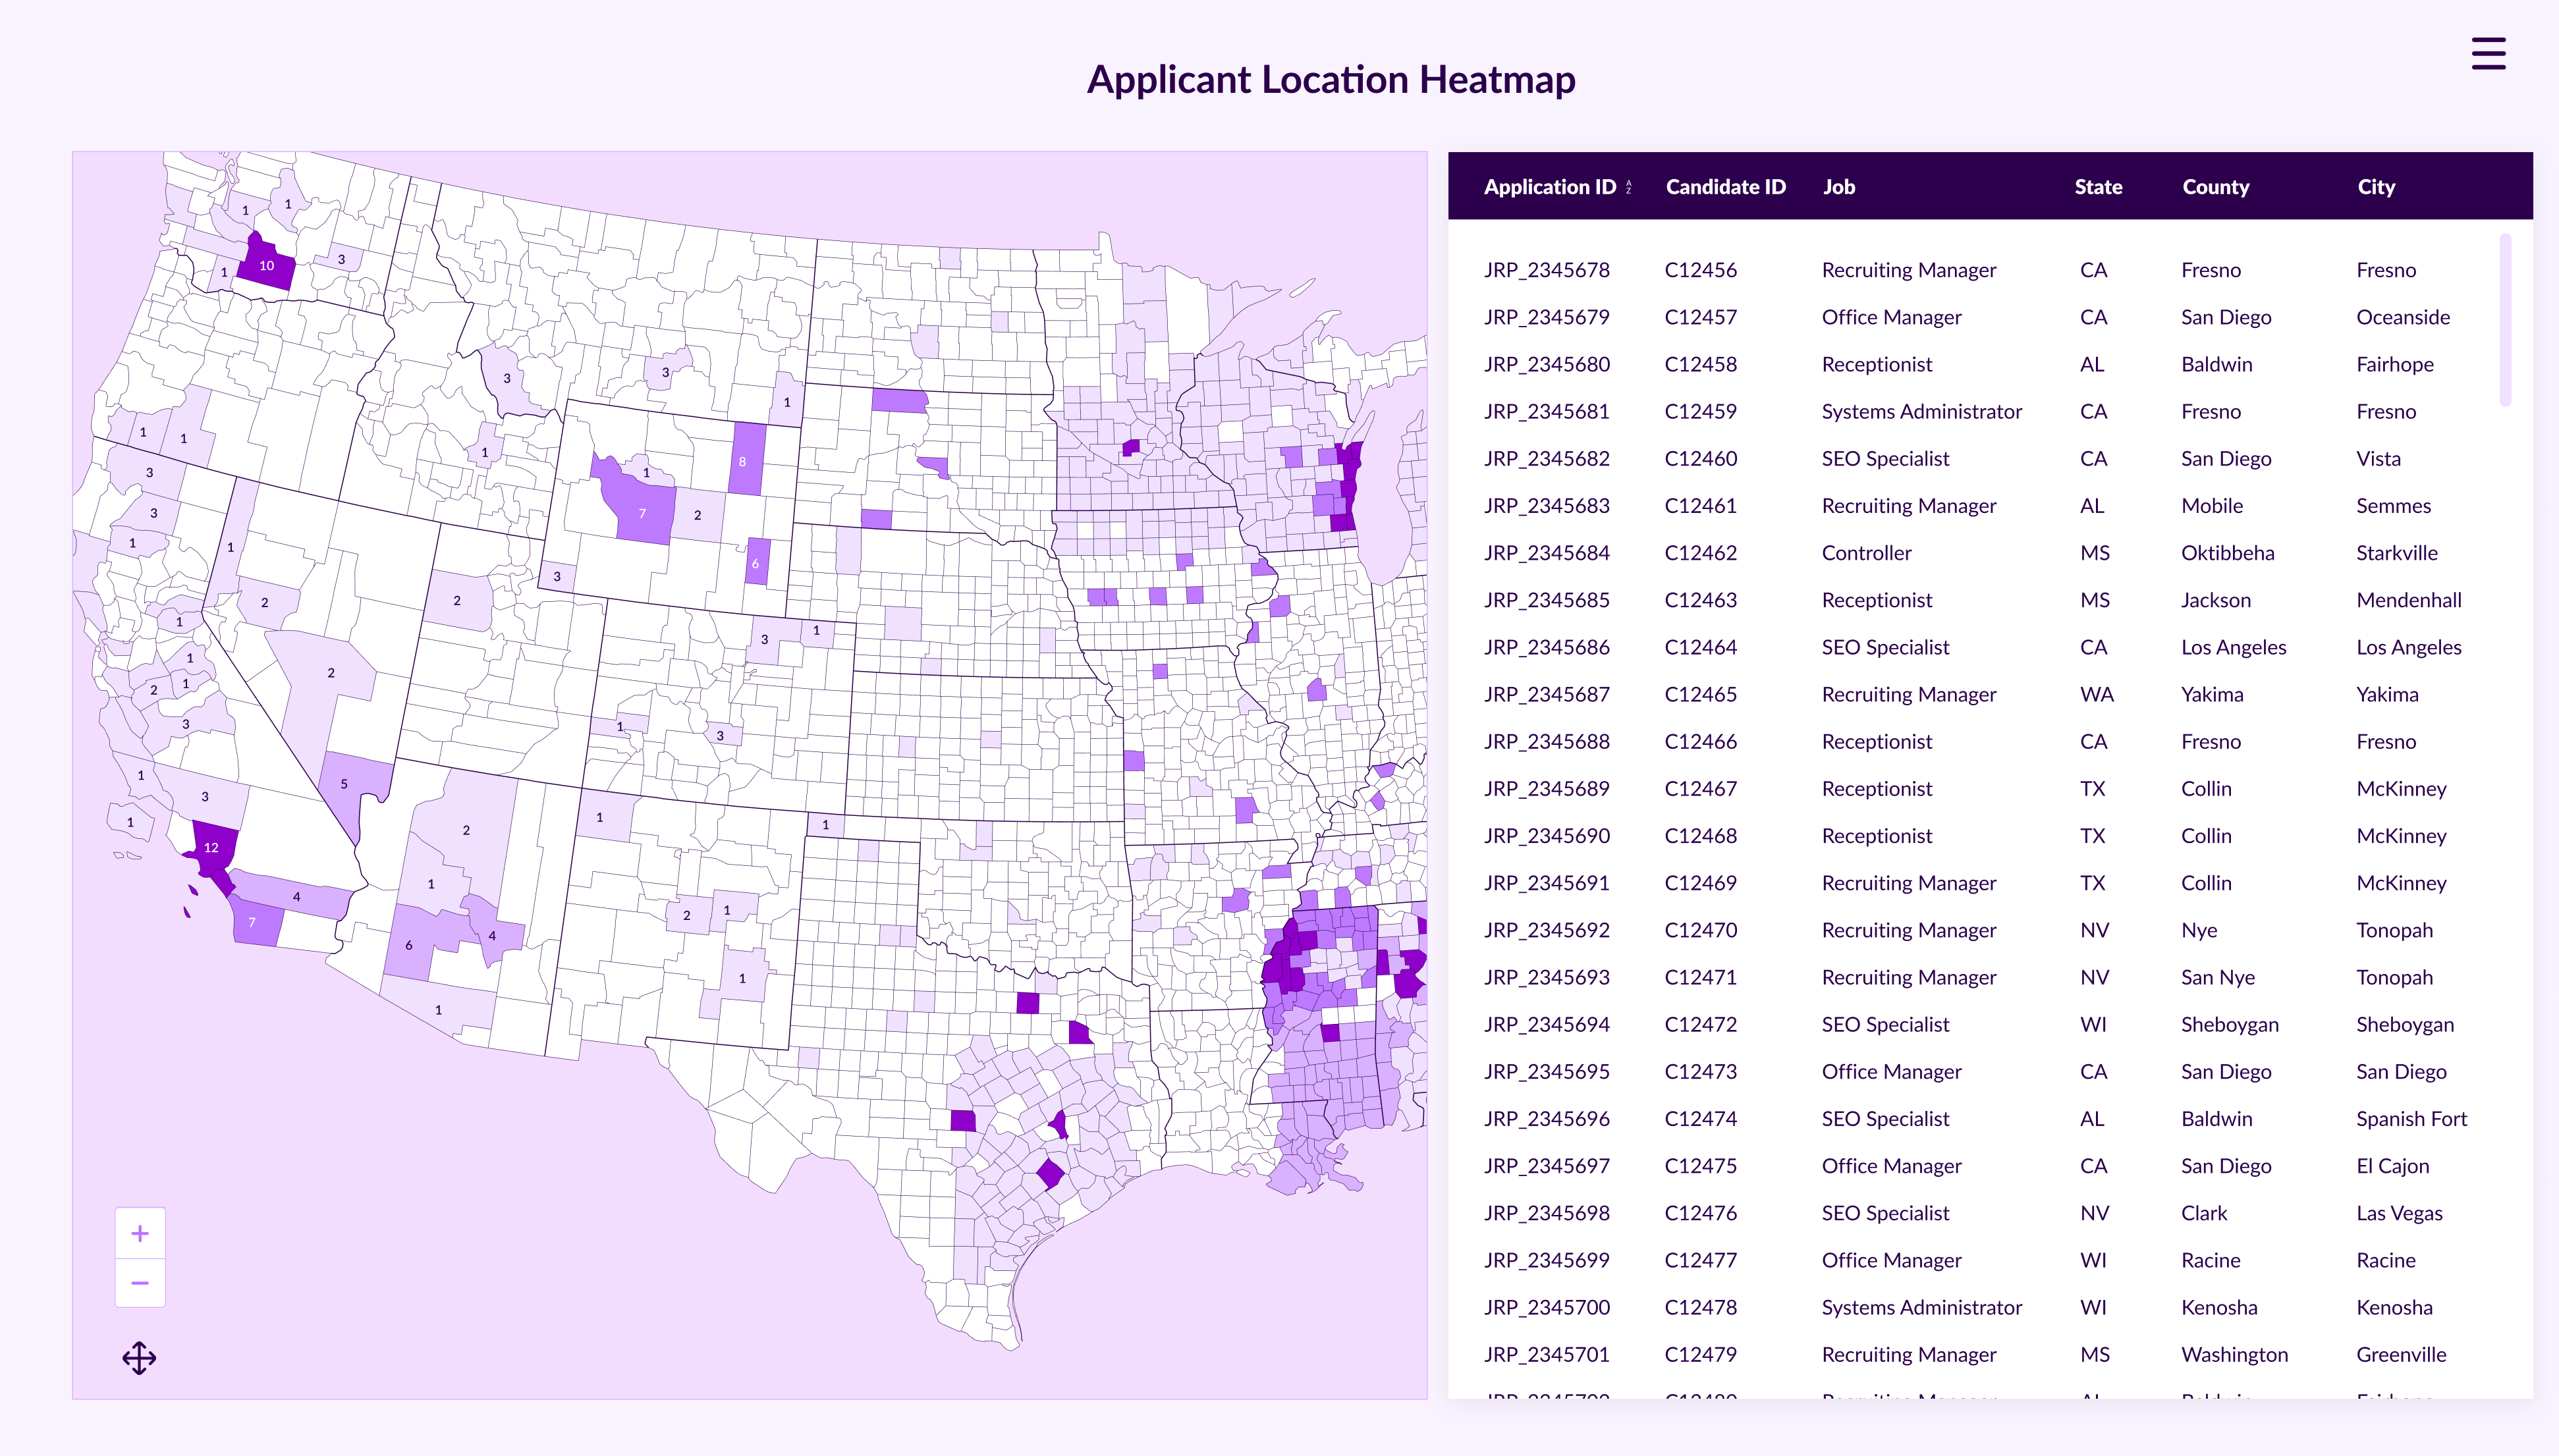
(To see a larger version, right click and open image in new tab)
Business Problem:
A recruitment team needed to optimize their marketing spend by focusing efforts on geographic areas with the highest potential for qualified applicants. Without visibility into where applicants were coming from, budget allocation decisions were based on assumptions rather than data, leading to inefficiencies and missed opportunities in talent sourcing.
How This Dashboard Helps:
A county-level map view was developed to visualize where applicants are applying from. This dashboard highlights geographic hotspots of applicant activity and identifies counties with low engagement. By surfacing this information, the team can pinpoint which regions yield the most applicants and determine where additional investment may be needed—or where spend can be reduced.
Impact:
This dashboard enables data-driven allocation of recruitment marketing budget. The team can now focus their outreach on high-performing counties, refine strategies for underrepresented areas, and ensure marketing dollars are being used where they’ll have the most impact. The result is a more strategic, efficient, and cost-effective recruitment process.
Please note: The dashboards featured in this workbook are design mock-ups inspired by real customer dashboards. Data and calculations are not reflective of real data.