
Show Bys are a powerful tool that provide the user with flexibility in their analysis. They look like filters and are located on analysis views and sometimes Dashboards. This article will go through where Show Bys are located and how Show Bys are used.
Where are Show Bys Located?
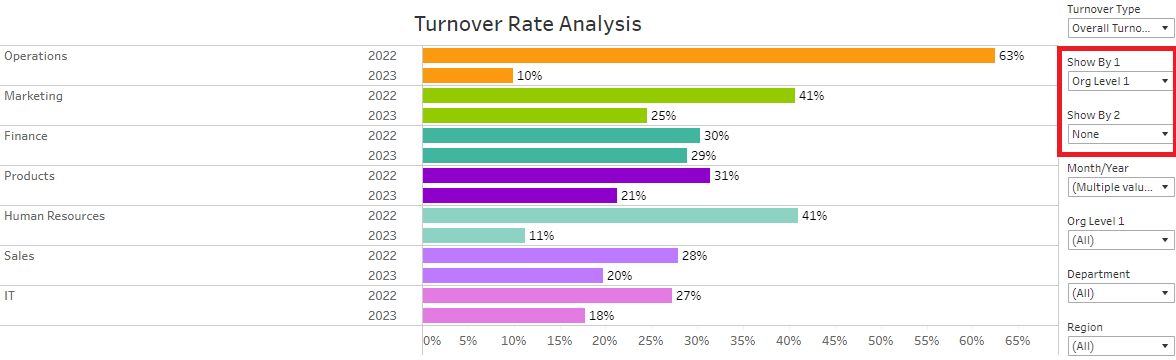
Show Bys are always located on Analysis views and sometimes Dashboard views. They look like filters and are labeled as ‘Show By’s.
For example, two Show Bys can be found in the filters pane of the Turnover Analysis view below, titled ‘Show By 1’ and ‘Show By 2’.
How are Show Bys Used?
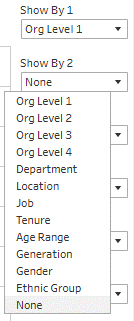
Show Bys provide a drop-down list of values that the user can select to break down the data.
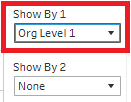
Currently, Show By 1 is set to ‘Org Level 1’ and Show By 2 is set to ‘None’ on the Turnover Analysis view.
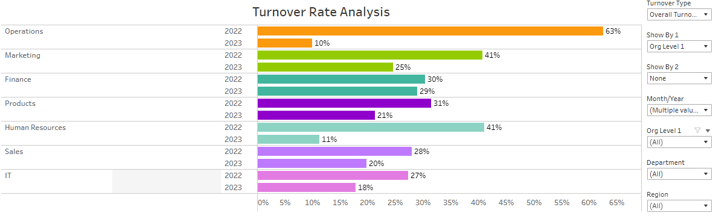
This causes the view to be broken down by Org Level 1.
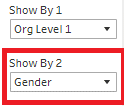
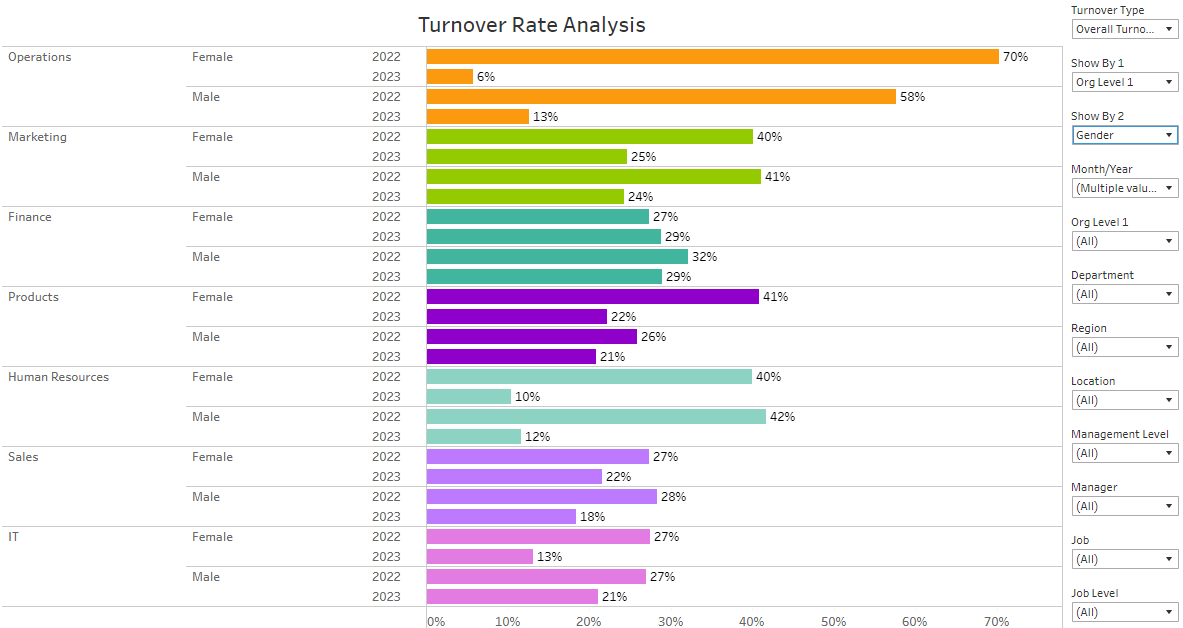
If the user is interested in seeing the turnover difference between male and female employees for each Org Level 1, then Show By 2 can be set to ‘Gender’.
This causes the view to be broken down by Org Level 1 and then by Gender.
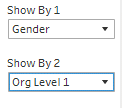
If the user is interested in seeing the turnover difference between Org Level 1 values for each gender, then Show By 1 can be set to ‘Gender’ and Show By 2 can be set to ‘Org Level 1’.
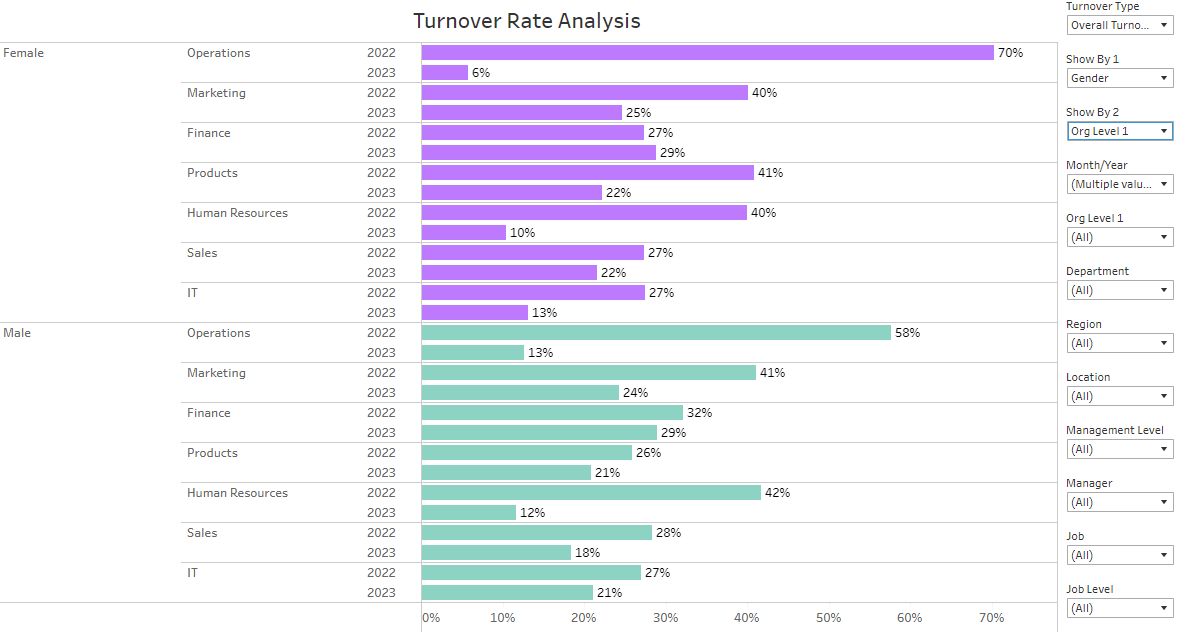
Overall, the flexibility of Show Bys provides the user with quick and easy visual comparisons that can be used to target specific needs. They can also help the user dive into the data and uncover gaps or trends on which they may want to take action.